My Portfolio
Thank you for visiting my portfolio! Here you can check out some actual examples of my work, which showcases projects I've done using SQL, Python, Tableau, and other data analytics tools.
Each project will highlight:
- A brief project summary
- What tools were used
- How it was built
- A sample vizualization
- Additional links (when available)
These are all original projects that are not part of any step-by-step tutorial. If you have any question, thoughts, or feedback please don't hesitate to reach out.

Projects
Housing Market Insights
#Python #Pandas #JavaScript #HTML #CSS #SQL
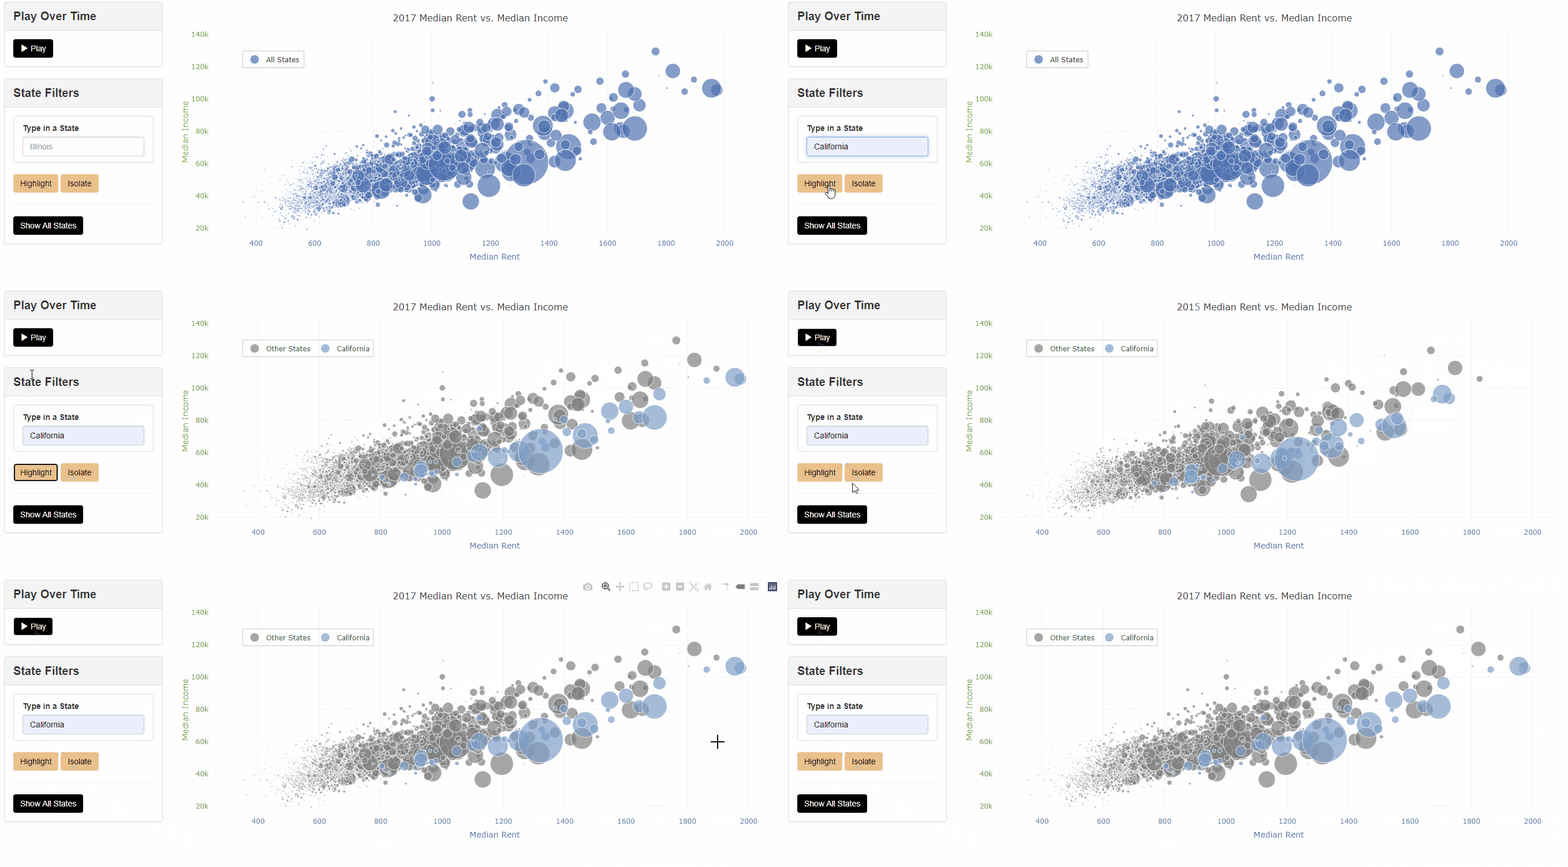
What It Is: This is an interactive app that allows a user to browse various housing market insights by US county such as rent, home value, income, and other measures.
Viz Below: "Plays" a bubble chart over time, showing rent prices outpaced income in California counties.
How It's Built: Uses a python flask app to serve data to the webpage from a SQL database. App built using HTML/CSS/Javascript and deployed on Heroku.
Links:
App: Webpage App
Github: Github ReadMe

IPO Stocks Database
#Python #Pandas #SQL #SQLAlchemy
What It Is: Pulls recent IPO stock timing, company, and performance data from the web and houses it in a SQL database.
Viz Below: Shows an ER diagram for the current schema setup of the SQL database.
How It's Built: Python scripts pull information from the web to add to and update the SQL database, where stored procedures add value to the dataset.
Links:
Github: Github ReadMe

Predictive Laptop Prices
#Python #Pandas #MachineLearning #JavaScript #HTML #CSS
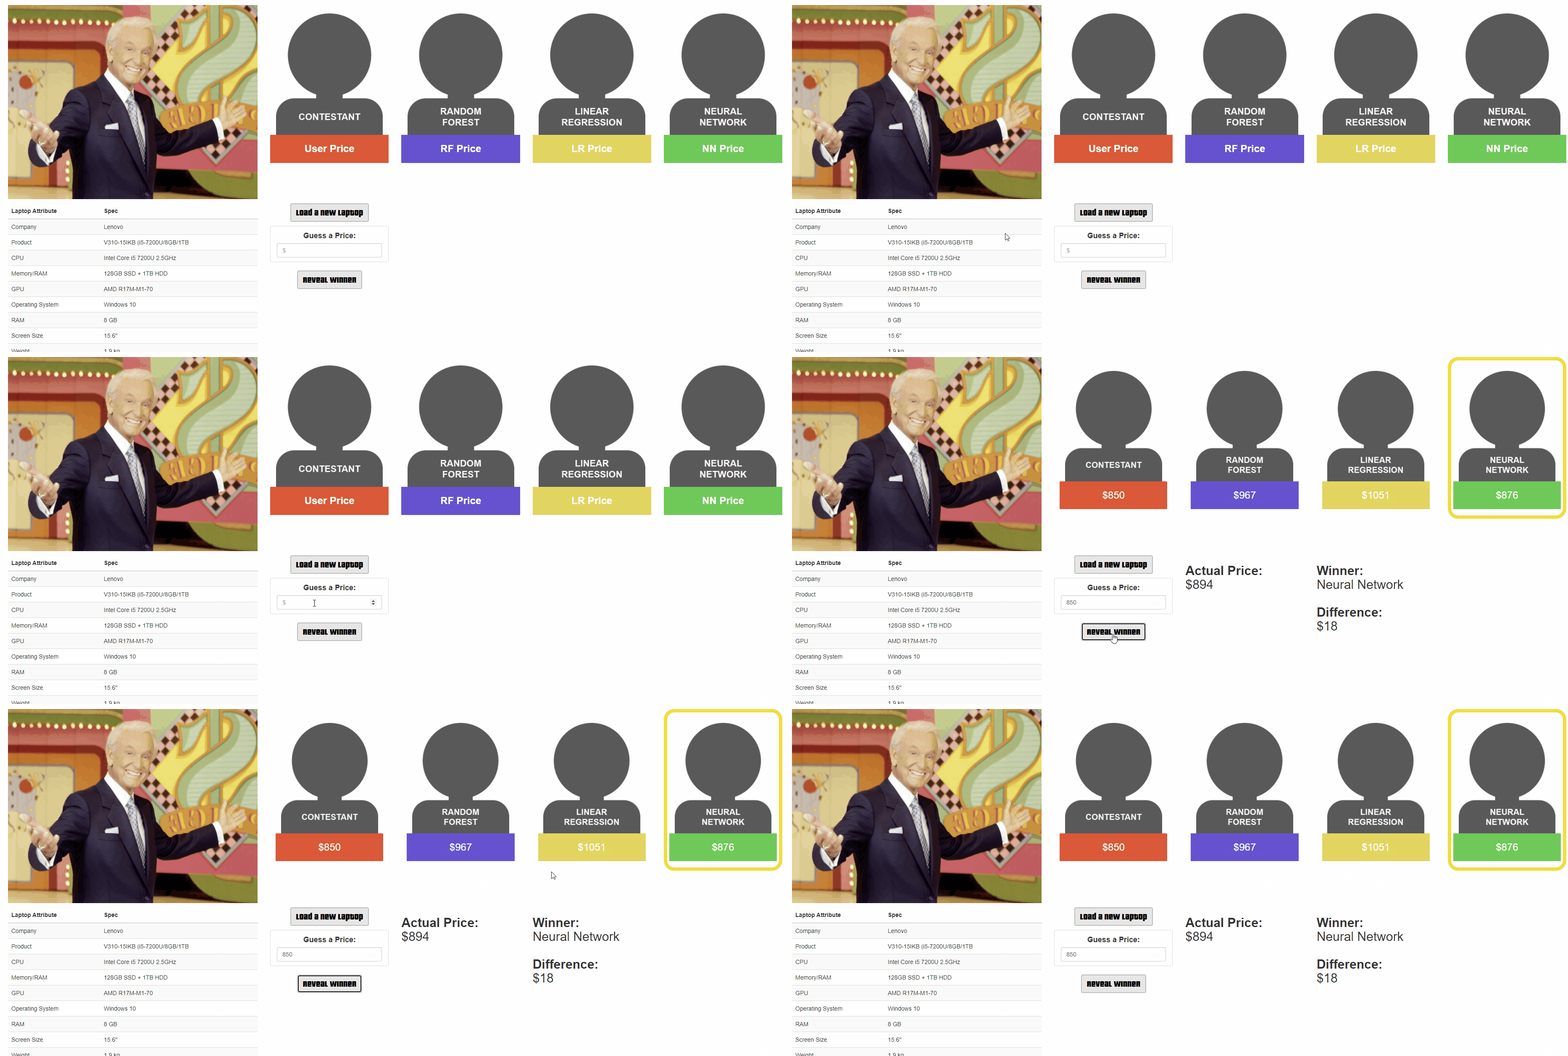
What It Is: A gamification app where a user guesses a laptop price based on product attributes against three machine trained models.
Viz Below: Shows a user entering a guess for a given laptop's price. Play for yourself HERE.
How It's Built: Leverages linear regression, random forest, and neural network machine learning models using Python.
Links:
App: Webpage App
Github: Github ReadMe

Category Management Dynamic Report
#AdvancedExcel #DAX #SQL
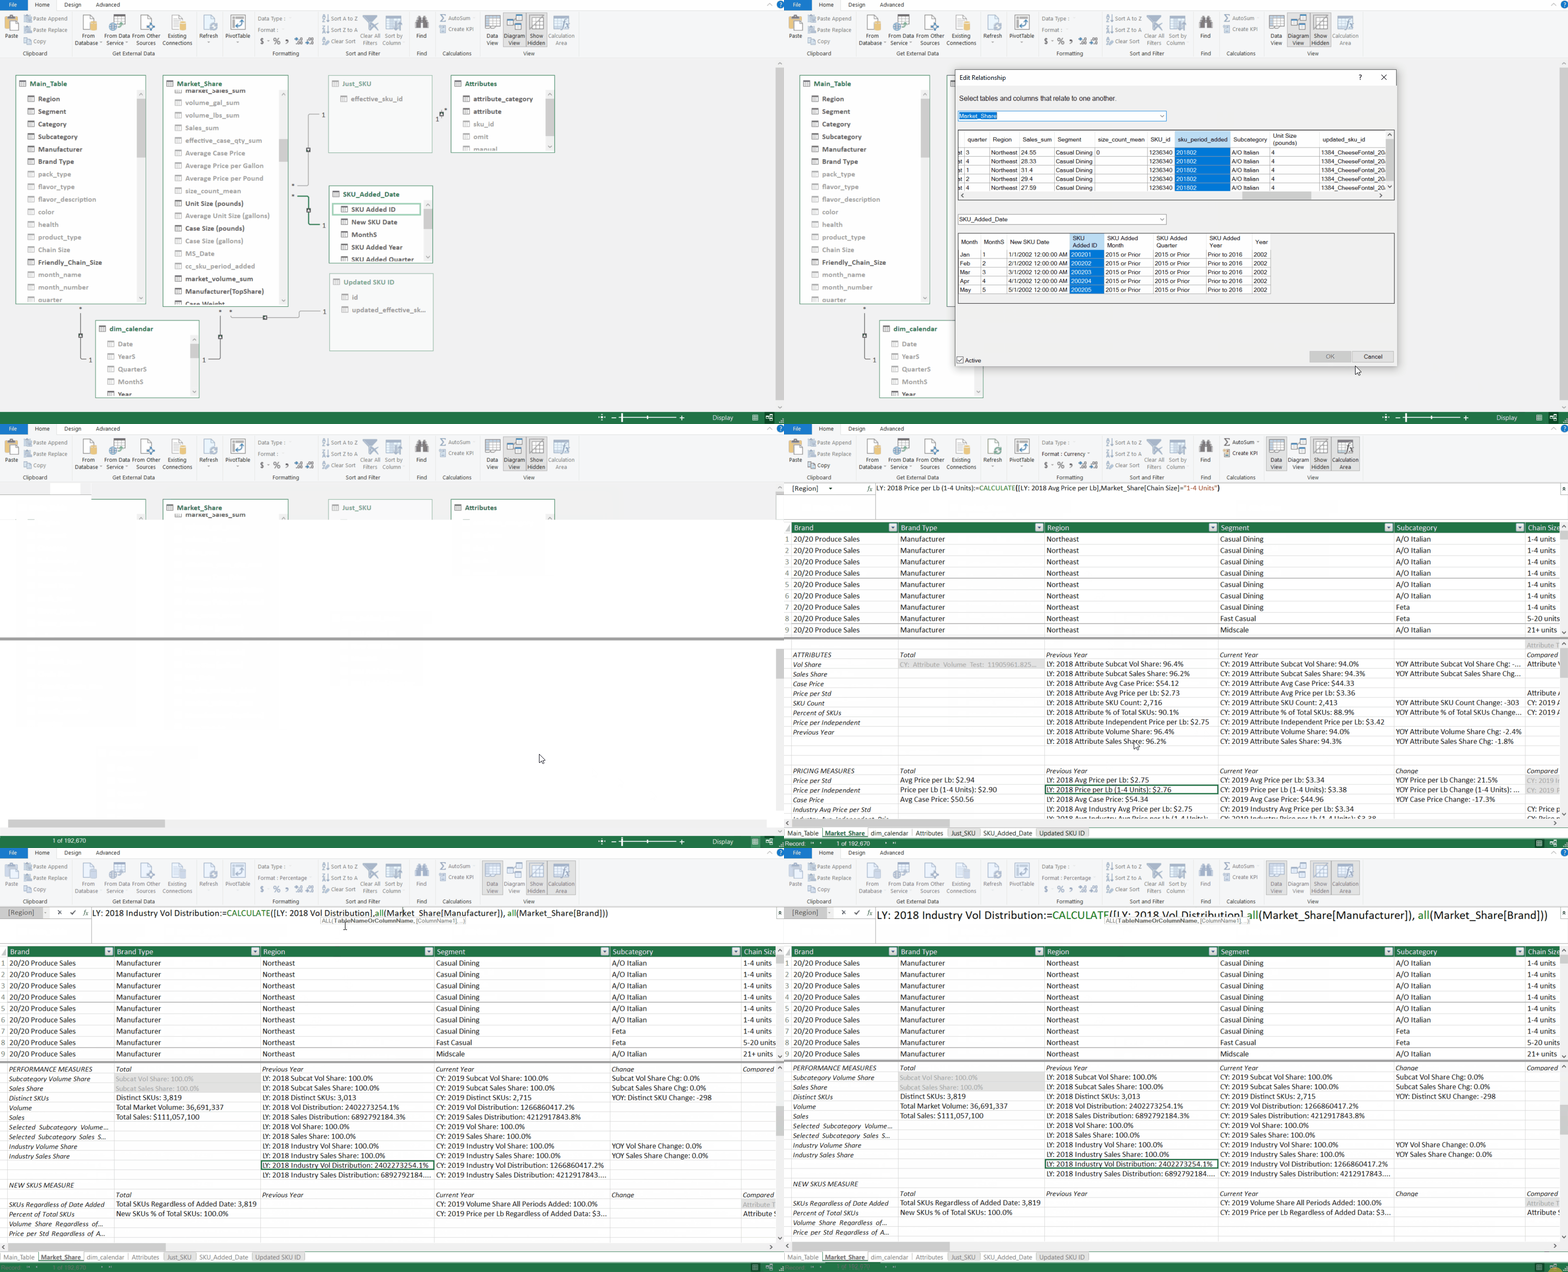
What It Is: A dynamic report that allows users to browse for food category performance, competition, price, attributes, and other category insights.
Viz Below (left): A view of the user experience in navigating portions of the report.
How It's Built: Excel connects to SQL using PowerPivot to create a data model, and DAX functions are used to create calculated fields.
Viz Below (right): A view of the backend data model which connects to SQL and the DAX measures.

